Custom ggplot2 theme following CSIDS visual guidelines with configurable grid lines and formatting.
Usage
theme_cs(
  base_size = 16,
  base_family = "",
  base_line_size = base_size/22,
  base_rect_size = base_size/22,
  legend_position = "right",
  x_axis_vertical = FALSE,
  panel_on_top = TRUE,
  panel.grid.major.x = FALSE,
  panel.grid.minor.x = FALSE,
  panel.grid.major.y = TRUE,
  panel.grid.minor.y = TRUE
)

set_x_axis_vertical()
Arguments
- base_size
Base font size in points (default: 16)
- base_family
Base font family (default: "")
- base_line_size
Base line size relative to base_size (default: base_size/22)
- base_rect_size
Base rectangle size relative to base_size (default: base_size/22)
- legend_position
Position of legend: "right", "left", "top", "bottom", or "none" (default: "right")
- x_axis_vertical
Logical: should x-axis labels be vertical? (default: FALSE)
- panel_on_top
Logical: should panel be drawn on top of data? (default: TRUE)
- panel.grid.major.x
Logical or element: major vertical grid lines (default: FALSE)
- panel.grid.minor.x
Logical or element: minor vertical grid lines (default: FALSE)
- panel.grid.major.y
Logical or element: major horizontal grid lines (default: TRUE)
- panel.grid.minor.y
Logical or element: minor horizontal grid lines (default: TRUE)
See also
Other csstyle_ggplot2:
scale_color_cs(),
scale_fill_cs()
Examples
library(ggplot2)
# Basic usage with default settings
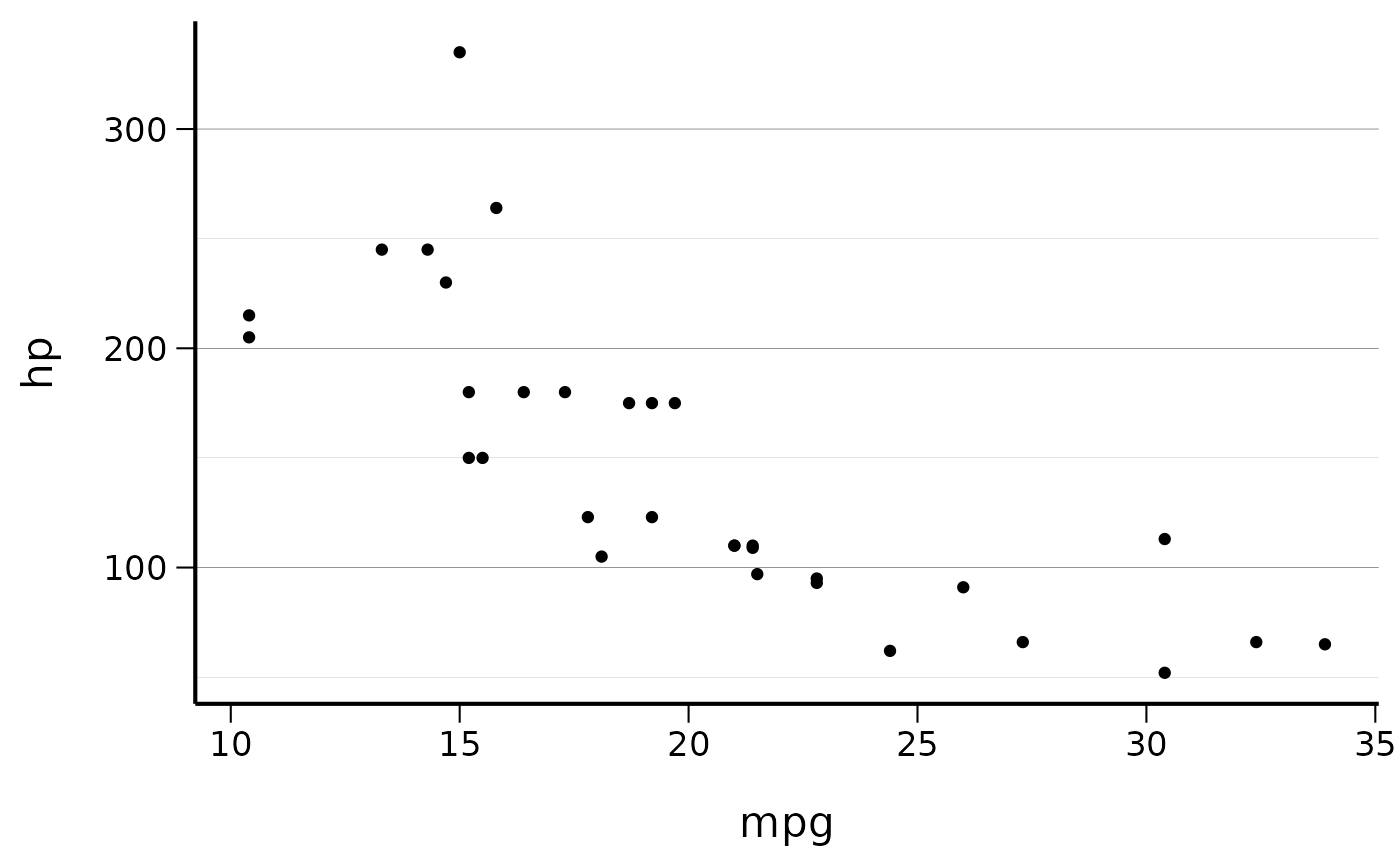
ggplot(mtcars, aes(x = mpg, y = hp)) +
geom_point() +
theme_cs()
 # With custom settings
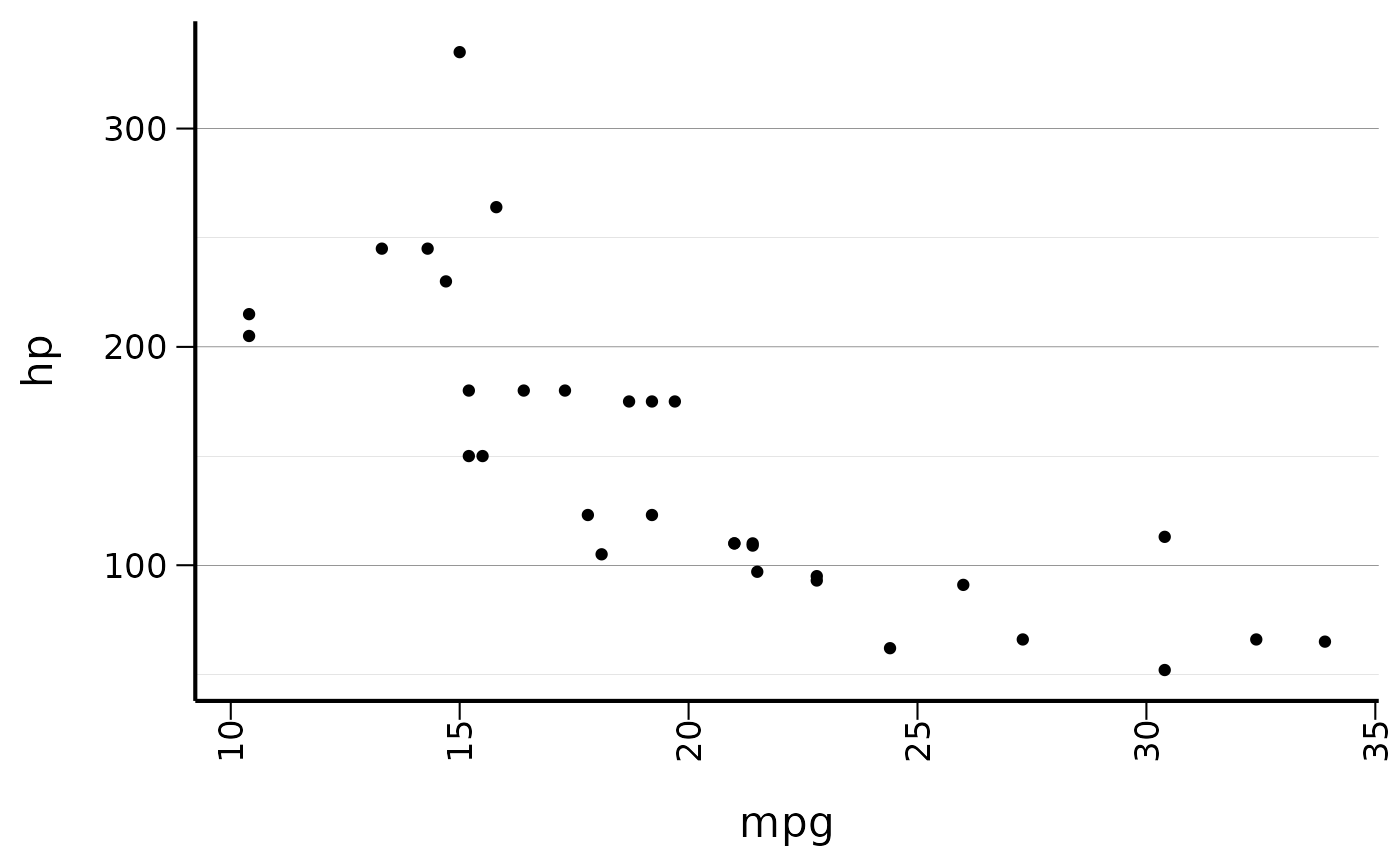
ggplot(mtcars, aes(x = mpg, y = hp)) +
geom_point() +
theme_cs(legend_position = "bottom", x_axis_vertical = TRUE)
# With custom settings
ggplot(mtcars, aes(x = mpg, y = hp)) +
geom_point() +
theme_cs(legend_position = "bottom", x_axis_vertical = TRUE)
 library(ggplot2)
# Add vertical x-axis labels to any plot
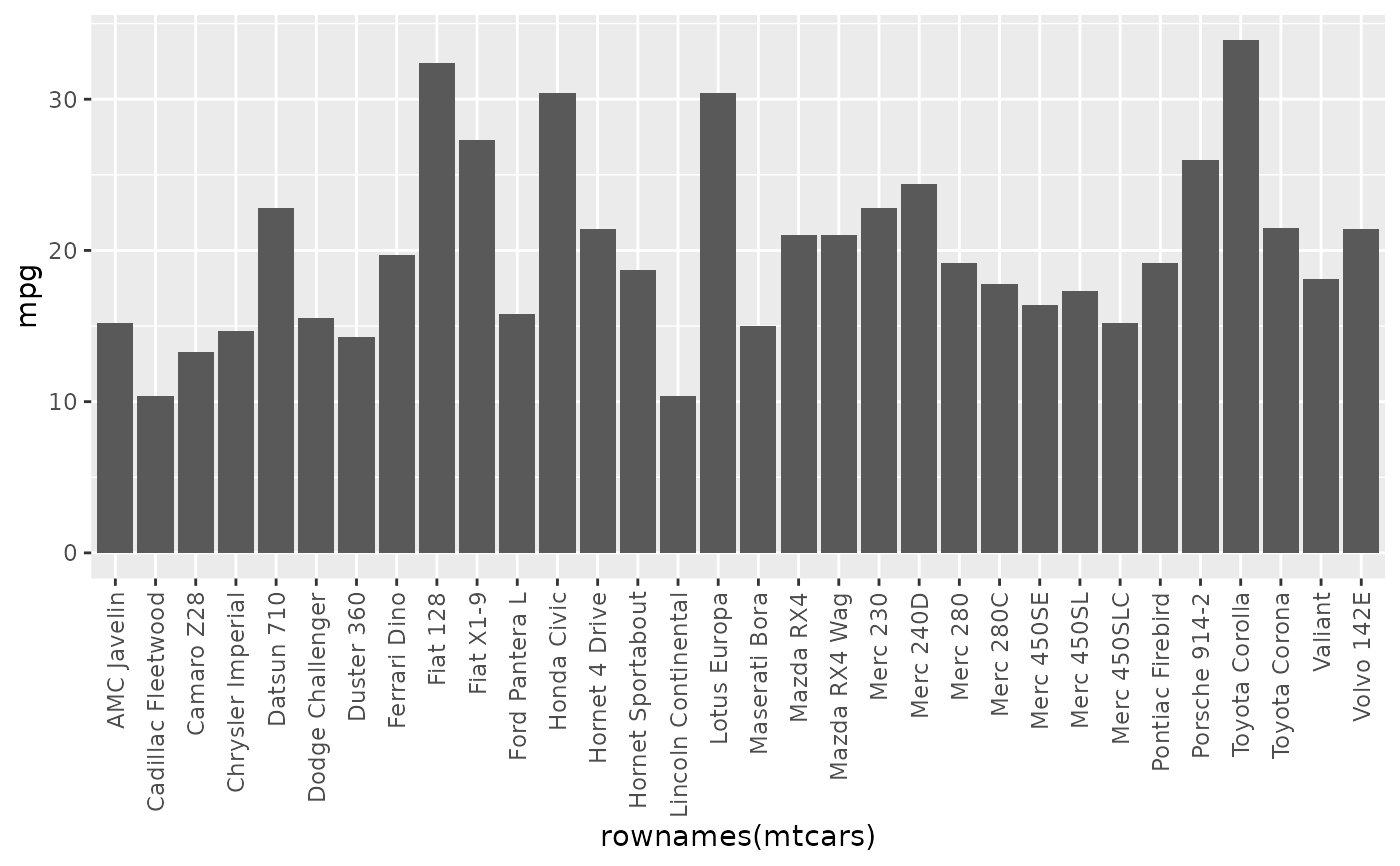
ggplot(mtcars, aes(x = rownames(mtcars), y = mpg)) +
geom_col() +
set_x_axis_vertical()
library(ggplot2)
# Add vertical x-axis labels to any plot
ggplot(mtcars, aes(x = rownames(mtcars), y = mpg)) +
geom_col() +
set_x_axis_vertical()