Populations are available in csdata::nor_population_by_age_cats().
pd <- csdata::nor_population_by_age_cats()[granularity_geo %in% "nation" & calyear>=1990]

q <- ggplot(pd, aes(x=calyear, y = pop_jan1_n))
q <- q + geom_line()
q <- q + geom_point(mapping = aes(color = imputed))
q <- q + scale_x_continuous("Calendar year (calyear)")
q <- q + scale_y_continuous("Population as of Jan 1 (pop_jan1_n)")
q <- q + scale_color_discrete("Imputed")
q <- q + labs(title = "Norway (nation_nor)")
q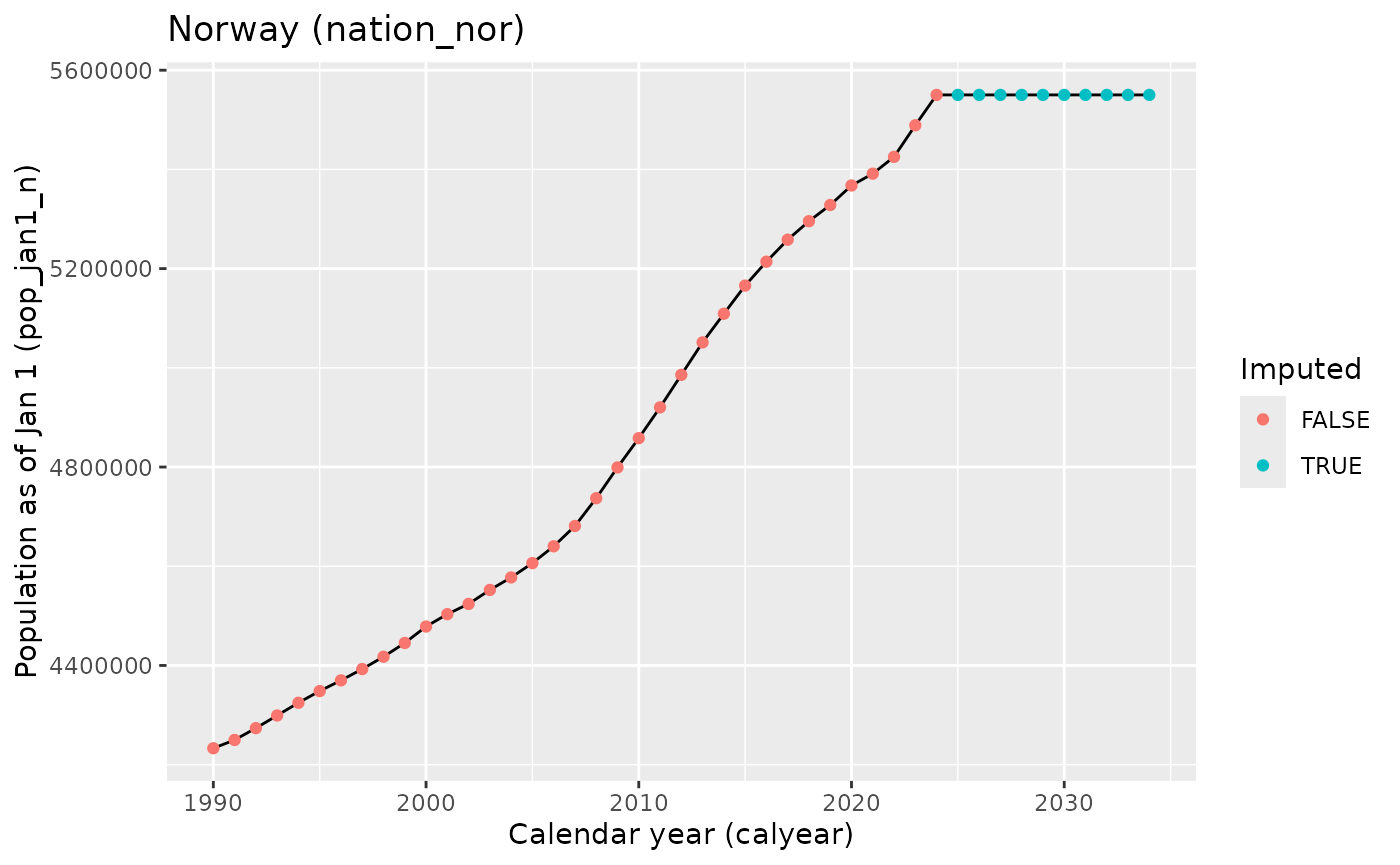
Here we list as a reference table the valid populations as of January 1st (pop_jan1_n).
| Reference table of calyear and pop_jan1_n (nation and georegion) | ||||||
| Norge-Noreg-Norway | Nord-Norge-Davvi-Norggas | Trøndelag-Trööndelage | Vestlandet | Agder | Østlandet-Austlandet | |
|---|---|---|---|---|---|---|
| 2005 | 4.606.363 | 443.484 | 404.688 | 1.177.947 | 264.872 | 2.290.302 |
| 2006 | 4.640.219 | 443.514 | 407.724 | 1.198.270 | 266.401 | 2.310.296 |
| 2007 | 4.681.134 | 442.950 | 411.519 | 1.209.253 | 268.461 | 2.334.412 |
| 2008 | 4.737.171 | 442.916 | 416.539 | 1.224.684 | 272.074 | 2.365.785 |
| 2009 | 4.799.252 | 444.309 | 421.114 | 1.241.760 | 275.592 | 2.400.614 |
| 2010 | 4.858.199 | 446.386 | 425.765 | 1.259.760 | 278.876 | 2.430.738 |
| 2011 | 4.920.305 | 448.865 | 429.886 | 1.278.247 | 282.456 | 2.463.286 |
| 2012 | 4.985.870 | 451.164 | 435.065 | 1.294.779 | 285.819 | 2.500.680 |
| 2013 | 5.051.275 | 474.556 | 440.861 | 1.314.728 | 289.125 | 2.532.434 |
| 2014 | 5.109.056 | 478.135 | 444.961 | 1.331.743 | 292.225 | 2.561.804 |
| 2015 | 5.165.802 | 480.743 | 449.384 | 1.346.948 | 295.644 | 2.592.454 |
| 2016 | 5.213.985 | 482.001 | 453.356 | 1.357.916 | 298.486 | 2.620.846 |
| 2017 | 5.258.317 | 484.638 | 458.216 | 1.364.902 | 300.789 | 2.649.758 |
| 2018 | 5.295.619 | 485.996 | 462.355 | 1.369.542 | 303.754 | 2.673.969 |
| 2019 | 5.328.212 | 486.452 | 465.632 | 1.373.738 | 305.244 | 2.697.141 |
| 2020 | 5.367.580 | 484.546 | 468.702 | 1.381.659 | 307.231 | 2.725.440 |
| 2021 | 5.391.369 | 482.513 | 471.124 | 1.387.010 | 308.843 | 2.741.879 |
| 2022 | 5.425.270 | 481.926 | 474.131 | 1.392.937 | 311.134 | 2.765.142 |
| 2023 | 5.488.984 | 483.536 | 478.470 | 1.406.924 | 316.051 | 2.804.007 |
| 2024 | 5.550.203 | 487.744 | 482.956 | 1.421.340 | 319.850 | 2.838.313 |
| 2025 | 5.550.203 | 487.744 | 482.956 | 1.421.340 | 319.850 | 2.838.313 |
| 2026 | 5.550.203 | 487.744 | 482.956 | 1.421.340 | 319.850 | 2.838.313 |
| 2027 | 5.550.203 | 487.744 | 482.956 | 1.421.340 | 319.850 | 2.838.313 |
| 2028 | 5.550.203 | 487.744 | 482.956 | 1.421.340 | 319.850 | 2.838.313 |
| 2029 | 5.550.203 | 487.744 | 482.956 | 1.421.340 | 319.850 | 2.838.313 |
| 2030 | 5.550.203 | 487.744 | 482.956 | 1.421.340 | 319.850 | 2.838.313 |
| 2031 | 5.550.203 | 487.744 | 482.956 | 1.421.340 | 319.850 | 2.838.313 |
| 2032 | 5.550.203 | 487.744 | 482.956 | 1.421.340 | 319.850 | 2.838.313 |
| 2033 | 5.550.203 | 487.744 | 482.956 | 1.421.340 | 319.850 | 2.838.313 |
| 2034 | 5.550.203 | 487.744 | 482.956 | 1.421.340 | 319.850 | 2.838.313 |
| Reference table of calyear and pop_jan1_n (county) | ||||||||
| Agder | Akershus | Buskerud | Finnmark-Finnmárkku | Innlandet-Sisdajven | Møre og Romsdal | Nordland-Nordlándda | Oslo-Oslove | |
|---|---|---|---|---|---|---|---|---|
| 2005 | 264.872 | 535.804 | 223.853 | 73.074 | 356.710 | 238.785 | 235.389 | 529.846 |
| 2006 | 266.401 | 543.132 | 225.183 | 72.937 | 356.885 | 242.621 | 234.859 | 538.411 |
| 2007 | 268.461 | 551.350 | 227.367 | 72.665 | 356.969 | 242.983 | 234.079 | 548.617 |
| 2008 | 272.074 | 561.324 | 230.429 | 72.399 | 358.072 | 244.275 | 233.652 | 560.484 |
| 2009 | 275.592 | 570.848 | 233.344 | 72.492 | 359.556 | 246.271 | 234.058 | 575.475 |
| 2010 | 278.876 | 579.994 | 236.200 | 72.856 | 361.057 | 248.785 | 234.928 | 586.860 |
| 2011 | 282.456 | 589.763 | 239.185 | 73.417 | 362.696 | 251.385 | 235.966 | 599.230 |
| 2012 | 285.819 | 600.980 | 242.966 | 73.787 | 364.679 | 254.113 | 237.036 | 613.285 |
| 2013 | 289.125 | 611.813 | 246.174 | 74.534 | 365.649 | 256.972 | 238.326 | 623.966 |
| 2014 | 292.225 | 621.848 | 248.857 | 75.207 | 366.785 | 259.130 | 239.622 | 634.463 |
| 2015 | 295.644 | 631.576 | 250.935 | 75.605 | 368.358 | 261.340 | 240.405 | 647.676 |
| 2016 | 298.486 | 641.783 | 253.383 | 75.758 | 368.636 | 262.914 | 240.630 | 658.390 |
| 2017 | 300.789 | 652.222 | 254.974 | 76.149 | 369.893 | 263.847 | 241.605 | 666.759 |
| 2018 | 303.754 | 662.452 | 256.539 | 76.167 | 370.994 | 264.422 | 242.071 | 673.469 |
| 2019 | 305.244 | 672.781 | 257.677 | 75.865 | 371.054 | 264.967 | 242.126 | 681.071 |
| 2020 | 307.231 | 682.092 | 259.626 | 75.472 | 371.385 | 265.236 | 241.235 | 693.494 |
| 2021 | 308.843 | 689.561 | 260.962 | 74.684 | 370.603 | 265.544 | 240.345 | 697.010 |
| 2022 | 311.134 | 701.565 | 262.911 | 74.129 | 371.253 | 265.848 | 240.190 | 699.827 |
| 2023 | 316.051 | 716.020 | 267.060 | 74.112 | 373.628 | 268.369 | 241.084 | 709.037 |
| 2024 | 319.850 | 728.803 | 269.819 | 75.053 | 376.304 | 270.624 | 243.081 | 717.710 |
| 2025 | 319.850 | 728.803 | 269.819 | 75.053 | 376.304 | 270.624 | 243.081 | 717.710 |
| 2026 | 319.850 | 728.803 | 269.819 | 75.053 | 376.304 | 270.624 | 243.081 | 717.710 |
| 2027 | 319.850 | 728.803 | 269.819 | 75.053 | 376.304 | 270.624 | 243.081 | 717.710 |
| 2028 | 319.850 | 728.803 | 269.819 | 75.053 | 376.304 | 270.624 | 243.081 | 717.710 |
| 2029 | 319.850 | 728.803 | 269.819 | 75.053 | 376.304 | 270.624 | 243.081 | 717.710 |
| 2030 | 319.850 | 728.803 | 269.819 | 75.053 | 376.304 | 270.624 | 243.081 | 717.710 |
| 2031 | 319.850 | 728.803 | 269.819 | 75.053 | 376.304 | 270.624 | 243.081 | 717.710 |
| 2032 | 319.850 | 728.803 | 269.819 | 75.053 | 376.304 | 270.624 | 243.081 | 717.710 |
| 2033 | 319.850 | 728.803 | 269.819 | 75.053 | 376.304 | 270.624 | 243.081 | 717.710 |
| 2034 | 319.850 | 728.803 | 269.819 | 75.053 | 376.304 | 270.624 | 243.081 | 717.710 |
| Reference table of calyear and pop_jan1_n (county) | |||||||
| Rogaland | Telemark | Troms-Romssa | Trøndelag-Trööndelage | Vestfold | Vestland | Østfold | |
|---|---|---|---|---|---|---|---|
| 2005 | 384.984 | 166.289 | 135.021 | 404.688 | 219.925 | 554.178 | 257.875 |
| 2006 | 397.594 | 166.140 | 135.718 | 407.724 | 220.826 | 558.055 | 259.719 |
| 2007 | 404.566 | 166.170 | 136.206 | 411.519 | 222.075 | 561.704 | 261.864 |
| 2008 | 412.687 | 166.731 | 136.865 | 416.539 | 223.936 | 567.722 | 264.809 |
| 2009 | 420.574 | 167.548 | 137.759 | 421.114 | 225.930 | 574.915 | 267.913 |
| 2010 | 427.947 | 168.231 | 138.602 | 425.765 | 227.422 | 583.028 | 270.974 |
| 2011 | 436.087 | 169.185 | 139.482 | 429.886 | 229.078 | 590.775 | 274.149 |
| 2012 | 443.115 | 170.023 | 140.341 | 435.065 | 231.083 | 597.551 | 277.664 |
| 2013 | 452.159 | 170.902 | 161.696 | 440.861 | 232.621 | 605.597 | 281.309 |
| 2014 | 459.625 | 171.469 | 163.306 | 444.961 | 234.092 | 612.988 | 284.290 |
| 2015 | 466.302 | 171.953 | 164.733 | 449.384 | 235.430 | 619.306 | 286.526 |
| 2016 | 470.175 | 172.494 | 165.613 | 453.356 | 236.965 | 624.827 | 289.195 |
| 2017 | 472.024 | 173.307 | 166.884 | 458.216 | 240.395 | 629.031 | 292.208 |
| 2018 | 473.526 | 173.391 | 167.758 | 462.355 | 242.386 | 631.594 | 294.738 |
| 2019 | 475.654 | 173.318 | 168.461 | 465.632 | 244.393 | 633.117 | 296.847 |
| 2020 | 479.892 | 173.355 | 167.839 | 468.702 | 246.041 | 636.531 | 299.447 |
| 2021 | 482.645 | 173.534 | 167.484 | 471.124 | 248.348 | 638.821 | 301.861 |
| 2022 | 485.797 | 173.970 | 167.607 | 474.131 | 250.862 | 641.292 | 304.754 |
| 2023 | 492.350 | 175.546 | 168.340 | 478.470 | 253.555 | 646.205 | 309.161 |
| 2024 | 499.417 | 177.093 | 169.610 | 482.956 | 256.432 | 651.299 | 312.152 |
| 2025 | 499.417 | 177.093 | 169.610 | 482.956 | 256.432 | 651.299 | 312.152 |
| 2026 | 499.417 | 177.093 | 169.610 | 482.956 | 256.432 | 651.299 | 312.152 |
| 2027 | 499.417 | 177.093 | 169.610 | 482.956 | 256.432 | 651.299 | 312.152 |
| 2028 | 499.417 | 177.093 | 169.610 | 482.956 | 256.432 | 651.299 | 312.152 |
| 2029 | 499.417 | 177.093 | 169.610 | 482.956 | 256.432 | 651.299 | 312.152 |
| 2030 | 499.417 | 177.093 | 169.610 | 482.956 | 256.432 | 651.299 | 312.152 |
| 2031 | 499.417 | 177.093 | 169.610 | 482.956 | 256.432 | 651.299 | 312.152 |
| 2032 | 499.417 | 177.093 | 169.610 | 482.956 | 256.432 | 651.299 | 312.152 |
| 2033 | 499.417 | 177.093 | 169.610 | 482.956 | 256.432 | 651.299 | 312.152 |
| 2034 | 499.417 | 177.093 | 169.610 | 482.956 | 256.432 | 651.299 | 312.152 |