Short term trend
Richard Aubrey White, Chi Zhang
2023-05-31
Source:vignettes/short_term_trend.Rmd
short_term_trend.RmdIn this vignette we illustrate how to compute short term trend with csalert::short_term_trend.
Single location
Covid-19 Hospitalization data
The Covid-19 hospitalization data contains both daily and weekly aggregated number of hospitalization due to Covid (as a main cause) for Norway. The data does not distinguish age groups or sex.
This dataset is extracted on 2022-05-04. The time period is from 2020-02-21 to 2022-05-03.
The data in csv and xlsx formats can be found on our Github repository.
Data in cstidy format
We have prepared the data into cstidy format, from which we can see the summary of each column, such as data type and amount of missing data.
d_hosp <- cstidy::nor_covid19_icu_and_hospitalization_csfmt_rts_v1
d_hosp
#>      granularity_time granularity_geo country_iso3 location_code border    age
#>                <char>          <char>       <char>        <char>  <int> <char>
#>   1:             date          nation          nor    nation_nor   2020  total
#>   2:             date          nation          nor    nation_nor   2020  total
#>   3:             date          nation          nor    nation_nor   2020  total
#>   4:             date          nation          nor    nation_nor   2020  total
#>   5:             date          nation          nor    nation_nor   2020  total
#>  ---
#> 915:      isoyearweek          nation          nor    nation_nor   2020  total
#> 916:      isoyearweek          nation          nor    nation_nor   2020  total
#> 917:      isoyearweek          nation          nor    nation_nor   2020  total
#> 918:      isoyearweek          nation          nor    nation_nor   2020  total
#> 919:      isoyearweek          nation          nor    nation_nor   2020  total
#>         sex isoyear isoweek isoyearweek    season seasonweek calyear calmonth
#>      <char>   <int>   <int>      <char>    <char>      <num>   <int>    <int>
#>   1:  total    2020       8     2020-08 2019/2020         31    2020        2
#>   2:  total    2020       8     2020-08 2019/2020         31    2020        2
#>   3:  total    2020       8     2020-08 2019/2020         31    2020        2
#>   4:  total    2020       9     2020-09 2019/2020         32    2020        2
#>   5:  total    2020       9     2020-09 2019/2020         32    2020        2
#>  ---
#> 915:  total    2022      14     2022-14      <NA>         NA      NA       NA
#> 916:  total    2022      15     2022-15      <NA>         NA      NA       NA
#> 917:  total    2022      16     2022-16      <NA>         NA      NA       NA
#> 918:  total    2022      17     2022-17      <NA>         NA      NA       NA
#> 919:  total    2022      18     2022-18      <NA>         NA      NA       NA
#>      calyearmonth       date icu_with_positive_pcr_n
#>            <char>     <Date>                   <int>
#>   1:     2020-M02 2020-02-21                       0
#>   2:     2020-M02 2020-02-22                       0
#>   3:     2020-M02 2020-02-23                       0
#>   4:     2020-M02 2020-02-24                       0
#>   5:     2020-M02 2020-02-25                       0
#>  ---
#> 915:         <NA> 2022-04-10                      21
#> 916:         <NA> 2022-04-17                      11
#> 917:         <NA> 2022-04-24                      17
#> 918:         <NA> 2022-05-01                       9
#> 919:         <NA> 2022-05-08                       0
#>      hospitalization_with_covid19_as_primary_cause_n
#>                                                <int>
#>   1:                                               0
#>   2:                                               0
#>   3:                                               0
#>   4:                                               0
#>   5:                                               0
#>  ---
#> 915:                                             211
#> 916:                                             157
#> 917:                                             137
#> 918:                                              74
#> 919:                                              10
Weekly observations
Now we run the short_term_trend function on weekly data.
d_hosp_weekly <- d_hosp[granularity_time=="isoyearweek"]

res <- csalert::short_term_trend(
  d_hosp_weekly,
  numerator = "hospitalization_with_covid19_as_primary_cause_n",
  trend_isoyearweeks = 6,
  remove_last_isoyearweeks = 1
)

# create the trend label
res[, hospitalization_with_covid19_as_primary_cause_trend0_41_status := factor(
  hospitalization_with_covid19_as_primary_cause_trend0_41_status,
  levels = c("training","forecast","notincreasing", "increasing"),
  labels = c("Training","Forecast","Not increasin", "Increasing")
)]

colnames(res)
#>  [1] "granularity_time"
#>  [2] "granularity_geo"
#>  [3] "country_iso3"
#>  [4] "location_code"
#>  [5] "border"
#>  [6] "age"
#>  [7] "sex"
#>  [8] "isoyear"
#>  [9] "isoweek"
#> [10] "isoyearweek"
#> [11] "season"
#> [12] "seasonweek"
#> [13] "calyear"
#> [14] "calmonth"
#> [15] "calyearmonth"
#> [16] "date"
#> [17] "icu_with_positive_pcr_n"
#> [18] "hospitalization_with_covid19_as_primary_cause_n"
#> [19] "hospitalization_with_covid19_as_primary_cause_forecasted_n"
#> [20] "hospitalization_with_covid19_as_primary_cause_forecasted_predinterval_q02x5_n"
#> [21] "hospitalization_with_covid19_as_primary_cause_forecasted_predinterval_q97x5_n"
#> [22] "hospitalization_with_covid19_as_primary_cause_forecasted_n_forecast"
#> [23] "hospitalization_with_covid19_as_primary_cause_trend0_41_status"
#> [24] "hospitalization_with_covid19_as_primary_cause_doublingdays0_41"
We can check some columns that have been added to the original data.
# check some columns
res[
  ,
  .(
    date,
    hospitalization_with_covid19_as_primary_cause_n,
    hospitalization_with_covid19_as_primary_cause_forecasted_n,
    hospitalization_with_covid19_as_primary_cause_trend0_41_status
  )
]
#>            date hospitalization_with_covid19_as_primary_cause_n
#>          <Date>                                           <int>
#>   1: 2020-02-23                                               0
#>   2: 2020-03-01                                               0
#>   3: 2020-03-08                                               2
#>   4: 2020-03-15                                              50
#>   5: 2020-03-22                                             188
#>  ---
#> 118: 2022-05-22                                              NA
#> 119: 2022-05-29                                              NA
#> 120: 2022-06-05                                              NA
#> 121: 2022-06-12                                              NA
#> 122: 2022-06-19                                              NA
#>      hospitalization_with_covid19_as_primary_cause_forecasted_n
#>                                                           <int>
#>   1:                                                          0
#>   2:                                                          0
#>   3:                                                          2
#>   4:                                                         50
#>   5:                                                        188
#>  ---
#> 118:                                                         40
#> 119:                                                         30
#> 120:                                                         23
#> 121:                                                         18
#> 122:                                                         13
#>      hospitalization_with_covid19_as_primary_cause_trend0_41_status
#>                                                              <fctr>
#>   1:                                                       Training
#>   2:                                                       Training
#>   3:                                                       Training
#>   4:                                                       Training
#>   5:                                                       Training
#>  ---
#> 118:                                                       Forecast
#> 119:                                                       Forecast
#> 120:                                                       Forecast
#> 121:                                                       Forecast
#> 122:                                                       Forecast
We can visualize the trend indicator with different colors.
q <- ggplot(
  res,
  aes(
    x = isoyearweek,
    y = hospitalization_with_covid19_as_primary_cause_forecasted_n,
    group = 1
  )
)
q <- q + geom_col(mapping = aes(fill = hospitalization_with_covid19_as_primary_cause_trend0_41_status))
q <- q + geom_errorbar(
  mapping = aes(
    ymin = hospitalization_with_covid19_as_primary_cause_forecasted_predinterval_q02x5_n,
    ymax = hospitalization_with_covid19_as_primary_cause_forecasted_predinterval_q97x5_n
  )
)
q <- q + scale_y_continuous("Weekly hospitalization with Covid-19 as primary cause", expand = c(0, 0.1))
q <- q + scale_x_discrete("Isoyearweek")
q <- q + expand_limits(y=0)
q <- q + scale_fill_brewer("6 week trend", palette = "Set1")
q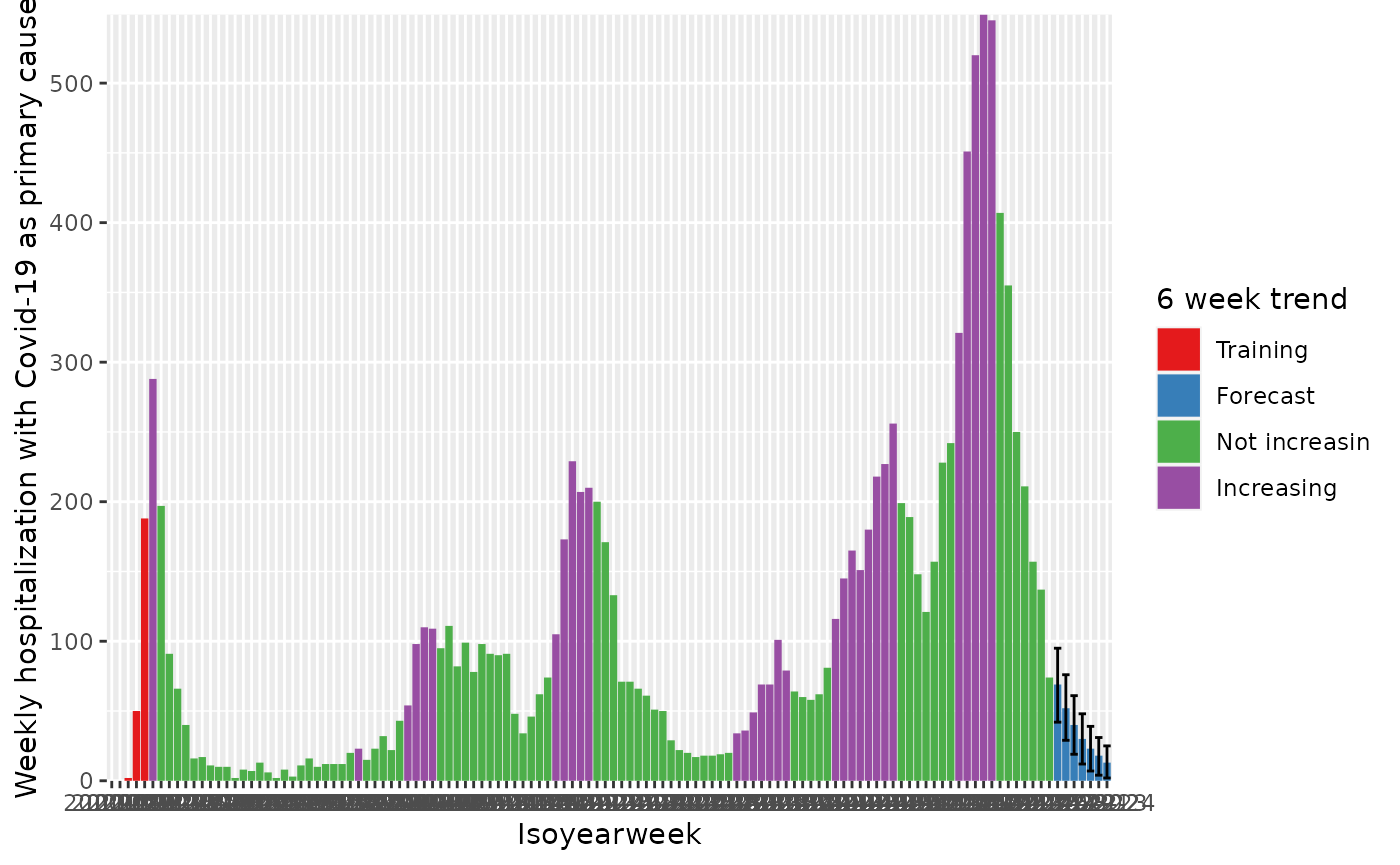
They can also be represented via shapes:
shape_adjustment_factor <- max(res$hospitalization_with_covid19_as_primary_cause_forecasted_n)*0.01
q <- ggplot(
  res,
  aes(
    x = isoyearweek,
    y = hospitalization_with_covid19_as_primary_cause_forecasted_n,
    group = 1
  )
)
q <- q + geom_col()
q <- q + geom_point(mapping = aes(
  y = hospitalization_with_covid19_as_primary_cause_forecasted_n + shape_adjustment_factor,
  shape = hospitalization_with_covid19_as_primary_cause_trend0_41_status
))
q <- q + geom_errorbar(
  mapping = aes(
    ymin = hospitalization_with_covid19_as_primary_cause_forecasted_predinterval_q02x5_n,
    ymax = hospitalization_with_covid19_as_primary_cause_forecasted_predinterval_q97x5_n
  )
)
q <- q + scale_y_continuous("Weekly hospitalization with Covid-19 as primary cause", expand = c(0, 0.1))
q <- q + scale_x_discrete("Isoyearweek")
q <- q + expand_limits(y=0)
q <- q + scale_shape_manual("6 week trend", values = c("Increasing" = 17, "Decreasing" = 6))
q
#> Warning: Removed 91 rows containing missing values or values outside the scale range
#> (`geom_point()`).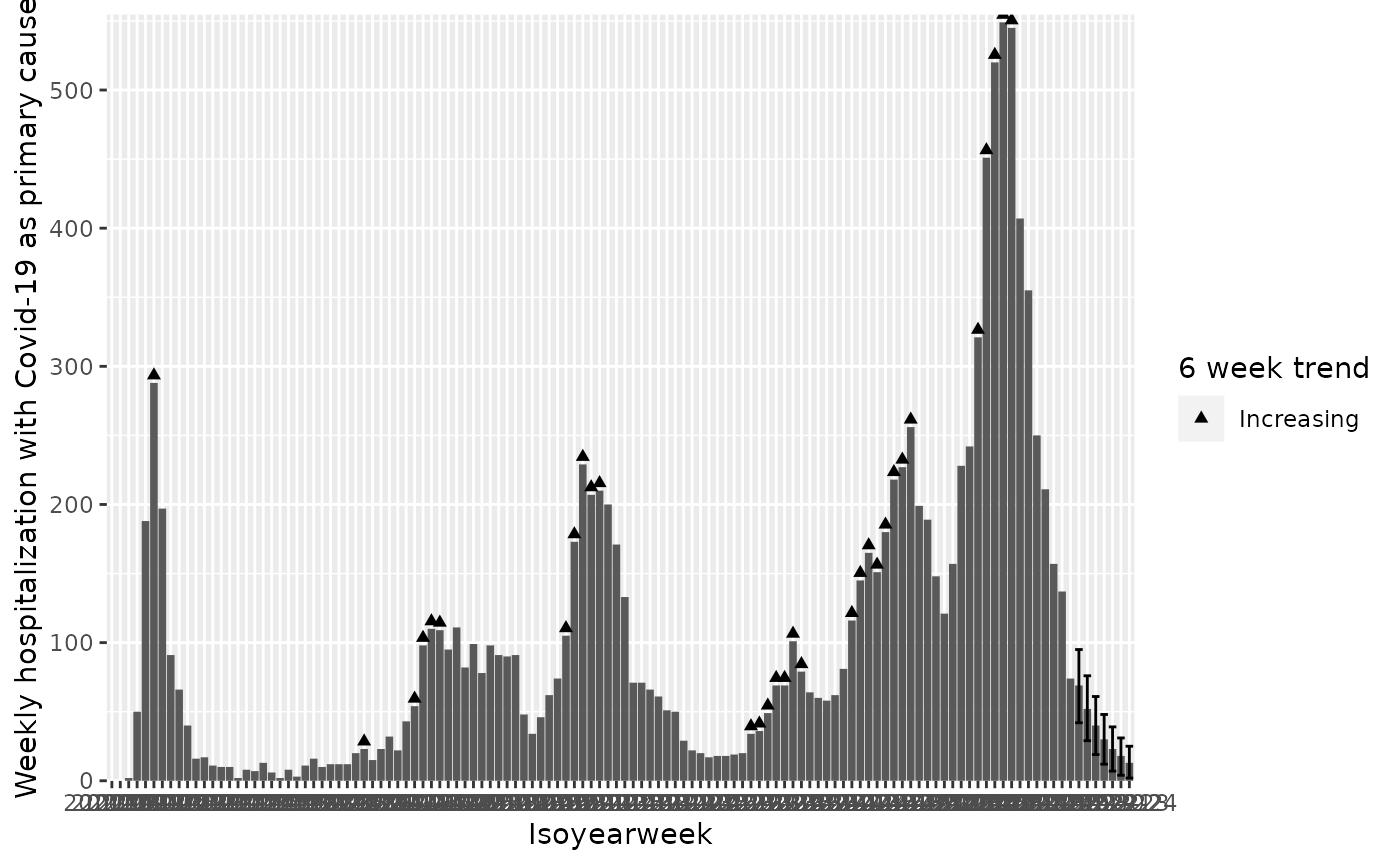
Multiple locations
d <- cstidy::nor_covid19_cases_by_time_location_csfmt_rts_v1[
  granularity_time == "isoyearweek" &
  granularity_geo == "county"
]

trend <- csalert::short_term_trend(
  d,
  numerator = "covid19_cases_testdate_n",
  trend_isoyearweeks = 6,
  remove_last_isoyearweeks = 1
)

print(trend)
#>       granularity_time granularity_geo country_iso3 location_code border    age
#>                 <char>          <char>       <char>        <char>  <int> <char>
#>    1:      isoyearweek          county          nor  county_nor03   2020  total
#>    2:      isoyearweek          county          nor  county_nor03   2020  total
#>    3:      isoyearweek          county          nor  county_nor03   2020  total
#>    4:      isoyearweek          county          nor  county_nor03   2020  total
#>    5:      isoyearweek          county          nor  county_nor03   2020  total
#>   ---
#> 1338:      isoyearweek          county          nor  county_nor54   2020  total
#> 1339:      isoyearweek          county          nor  county_nor54   2020  total
#> 1340:      isoyearweek          county          nor  county_nor54   2020  total
#> 1341:      isoyearweek          county          nor  county_nor54   2020  total
#> 1342:      isoyearweek          county          nor  county_nor54   2020  total
#>          sex isoyear isoweek isoyearweek    season seasonweek calyear calmonth
#>       <char>   <int>   <int>      <char>    <char>      <num>   <int>    <int>
#>    1:  total    2020       8     2020-08 2019/2020         31      NA       NA
#>    2:  total    2020       9     2020-09 2019/2020         32      NA       NA
#>    3:  total    2020      10     2020-10 2019/2020         33      NA       NA
#>    4:  total    2020      11     2020-11 2019/2020         34      NA       NA
#>    5:  total    2020      12     2020-12 2019/2020         35      NA       NA
#>   ---
#> 1338:  total    2022      20     2022-20 2021/2022         43      NA       NA
#> 1339:  total    2022      21     2022-21 2021/2022         44      NA       NA
#> 1340:  total    2022      22     2022-22 2021/2022         45      NA       NA
#> 1341:  total    2022      23     2022-23 2021/2022         46      NA       NA
#> 1342:  total    2022      24     2022-24 2021/2022         47      NA       NA
#>       calyearmonth       date covid19_cases_testdate_n
#>             <char>     <Date>                    <int>
#>    1:         <NA> 2020-02-23                        0
#>    2:         <NA> 2020-03-01                        7
#>    3:         <NA> 2020-03-08                       39
#>    4:         <NA> 2020-03-15                      276
#>    5:         <NA> 2020-03-22                      366
#>   ---
#> 1338:         <NA> 2022-05-22                       NA
#> 1339:         <NA> 2022-05-29                       NA
#> 1340:         <NA> 2022-06-05                       NA
#> 1341:         <NA> 2022-06-12                       NA
#> 1342:         <NA> 2022-06-19                       NA
#>       covid19_cases_testdate_pr100000 covid19_cases_testdate_forecasted_n
#>                                 <num>                               <int>
#>    1:                        0.000000                                   0
#>    2:                        1.009381                                   7
#>    3:                        5.623697                                  39
#>    4:                       39.798470                                 276
#>    5:                       52.776232                                 366
#>   ---
#> 1338:                              NA                                  12
#> 1339:                              NA                                   7
#> 1340:                              NA                                   4
#> 1341:                              NA                                   3
#> 1342:                              NA                                   2
#>       covid19_cases_testdate_forecasted_predinterval_q02x5_n
#>                                                        <num>
#>    1:                                                     NA
#>    2:                                                     NA
#>    3:                                                     NA
#>    4:                                                     NA
#>    5:                                                     NA
#>   ---
#> 1338:                                                     -9
#> 1339:                                                     -9
#> 1340:                                                     -8
#> 1341:                                                     -7
#> 1342:                                                     -6
#>       covid19_cases_testdate_forecasted_predinterval_q97x5_n
#>                                                        <num>
#>    1:                                                     NA
#>    2:                                                     NA
#>    3:                                                     NA
#>    4:                                                     NA
#>    5:                                                     NA
#>   ---
#> 1338:                                                     34
#> 1339:                                                     24
#> 1340:                                                     17
#> 1341:                                                     12
#> 1342:                                                      9
#>       covid19_cases_testdate_forecasted_n_forecast
#>                                             <lgcl>
#>    1:                                        FALSE
#>    2:                                        FALSE
#>    3:                                        FALSE
#>    4:                                        FALSE
#>    5:                                        FALSE
#>   ---
#> 1338:                                         TRUE
#> 1339:                                         TRUE
#> 1340:                                         TRUE
#> 1341:                                         TRUE
#> 1342:                                         TRUE
#>       covid19_cases_testdate_trend0_41_status
#>                                        <fctr>
#>    1:                                training
#>    2:                                training
#>    3:                                training
#>    4:                                training
#>    5:                                training
#>   ---
#> 1338:                                forecast
#> 1339:                                forecast
#> 1340:                                forecast
#> 1341:                                forecast
#> 1342:                                forecast
#>       covid19_cases_testdate_doublingdays0_41
#>                                         <num>
#>    1:                                      NA
#>    2:                                      NA
#>    3:                                      NA
#>    4:                                      NA
#>    5:                                      NA
#>   ---
#> 1338:                                      NA
#> 1339:                                      NA
#> 1340:                                      NA
#> 1341:                                      NA
#> 1342:                                      NA
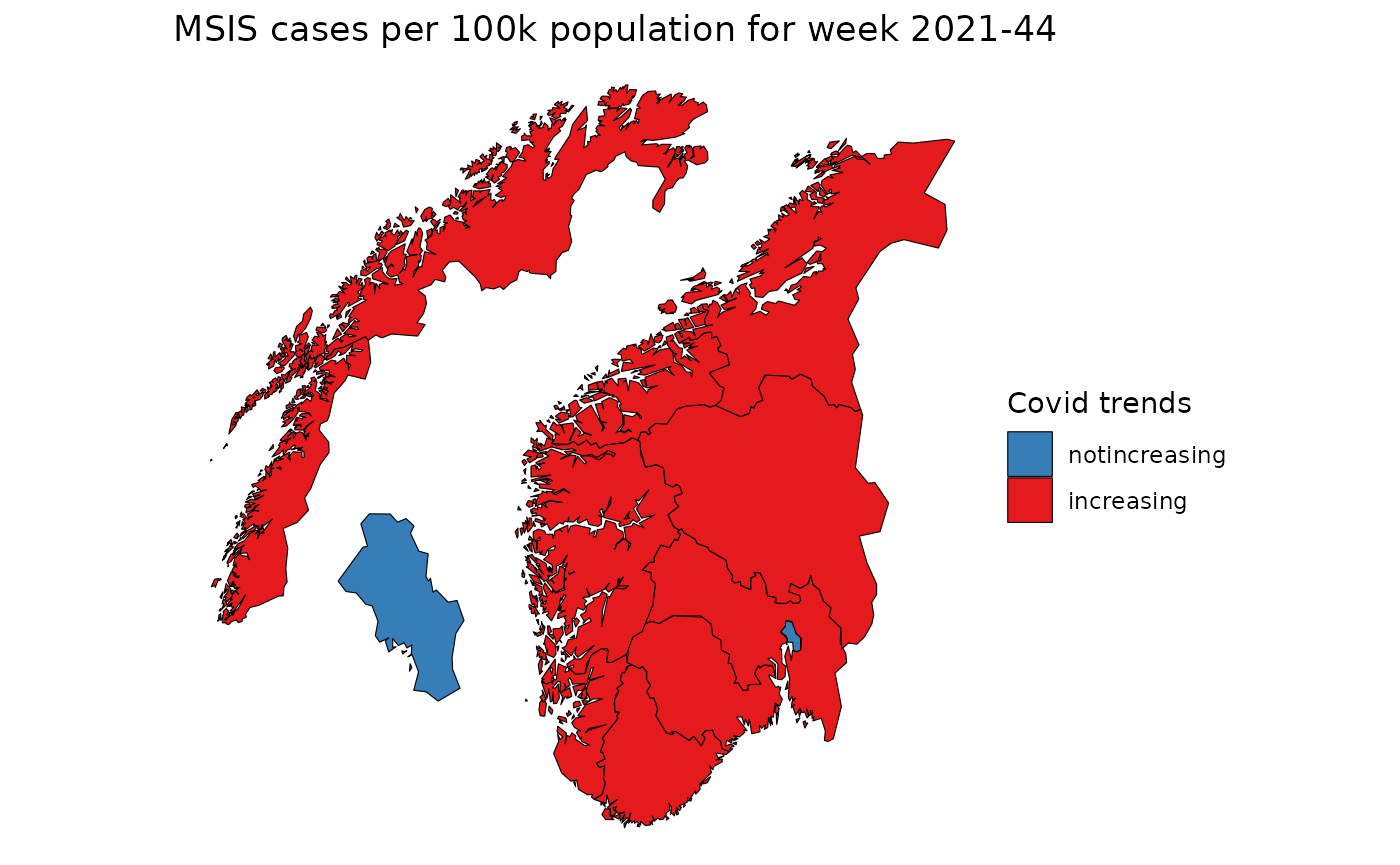
pd <- copy(csmaps::nor_county_map_b2020_split_dt)
pd[
  trend[isoyearweek == "2021-44"],
  on = c("location_code"),
  covid19_cases_testdate_trend0_41_status := covid19_cases_testdate_trend0_41_status
]

# plot map
q <- ggplot()
q <- q + geom_polygon(
  data = pd,
  mapping = aes(x = long, y = lat, group = group,fill=covid19_cases_testdate_trend0_41_status),
  color="black",
  linewidth = 0.2
)
q <- q + coord_quickmap()
q <- q + theme_void()
q <- q + labs(title="MSIS cases per 100k population for week 2021-44")
q <- q + scale_fill_brewer("Covid trends", palette = "Set1", direction = -1)
q